Análisis estereológico de estructuras 3D utilizando imágenes de sección o proyección 2D
Stereology Analyzer es una herramienta de software simple de usar para estimar de forma fiable las cuantificaciones de estructuras 3D importantes. Esta herramienta es general en su implementación, pero tiene aplicabilidad a varios ámbitos científicos, más comúnmente en medicina, ciencia de materiales y geología.
Los factores comunes en estos campos son la necesidad de caracterizar y cuantificar estructuras microscópicas de interés («SOI») y el uso de imágenes muy grandes (es decir, diapositivas virtuales o imágenes compuestas).
Donde los procesos automatizados no existen o no pueden calcular los parámetros SOI de forma fiable, la estereología es el método de elección para valorar estos parámetros. De hecho, la estereología también se utiliza con frecuencia para validar el rendimiento adecuado de algoritmos complejos y automatizados. Stereology Analyzer es una implementación fiel de métodos estereológicos y estadísticos aceptados desde hace mucho tiempo en el contexto de la tecnología de software actual.
- CienciaEstructuras de Interés
- MedicinaTumor, vasos, células, hot spot, etc.
- MaterialesGrano, inclusión, frontera, poro, etc.
- GeologíaPoro, fase, etc.
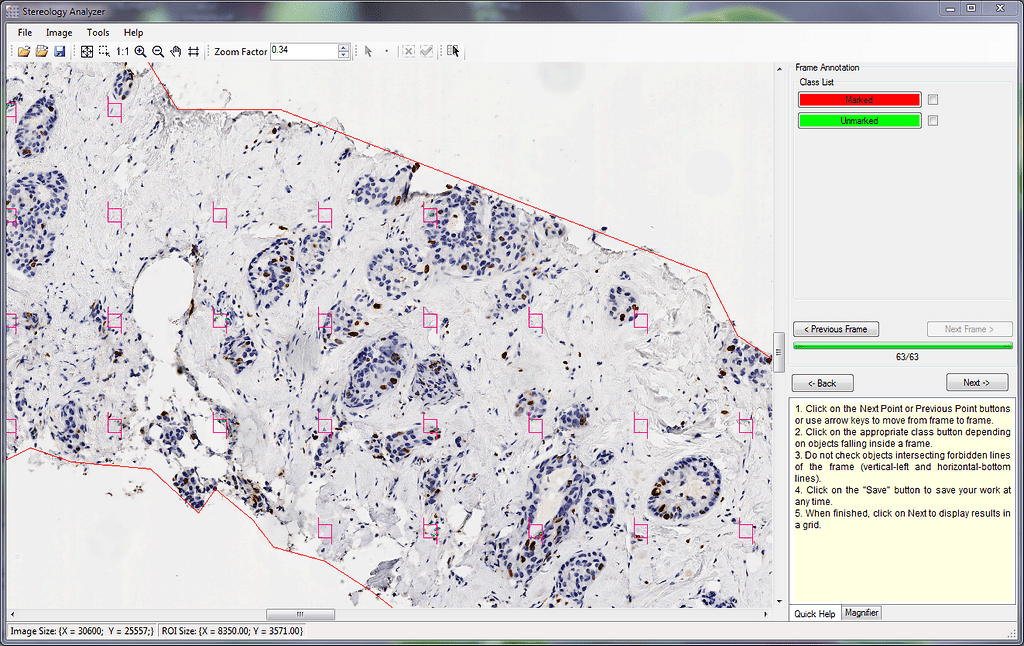
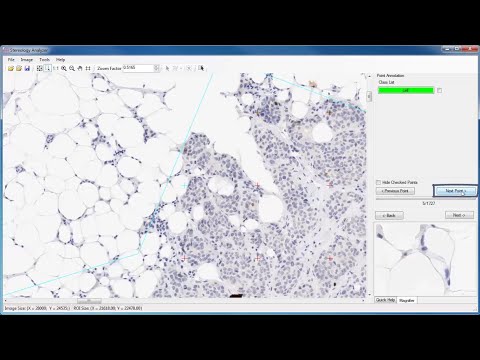
Interfaz gráfica de usuario de Stereology Analyzer
El contexto de la estereología
El término de estereología se introdujo por primera vez en 1961 cuando la International Society for Stereology (ISS) fue creada por un pequeño grupo de científicos, aunque la base de la teoría de lo que es la estereología fue definida hace más de 300 años. Por definición, la estereología es la ciencia que estudia la relación geométrica entre una estructura que existe en un espacio 3D y un conjunto de imágenes de una misma estructura definidas fundamentalmente en el espacio 2D (imágenes de corte, secciones o proyecciones). Se tiene que tener en cuenta que las técnicas estándar de procesamiento de imágenes 2D difícilmente proporcionarán información 3D de las secciones, excepto por el valor de fracción de volumen.
presentación del software Stereology Analyzer
Stereology Analyzer es una cuadrícula interactiva superpuesta sobre regiones de interés (ROI) en una imagen 2D. El analizador de estereología permite al usuario definir opcionalmente una o más ROIs o toda la imagen. El tipo y espacio de la cuadrícula puede ser ajustado por el usuario para obtener las mejores estimaciones de los parámetros de SOI contenidos en los OIE. Los tipos de cuadrículas se caracterizan por el elemento geométrico que se muestra en los nodos de la cuadrícula. Las alternativas de elementos de cuadrícula incluyen puntos, líneas, marcos, cuadrados y círculos.
Una vez que la cuadrícula, así como los ROIs definidos, el usuario puede de forma manual resaltar las SOIs que son interceptadas por los elementos de la cuadricula. El número de elementos contenidos en las cuadrículas y el número de IIS resaltados se contabilizan automáticamente y se utilizan para calcular los parámetros de SOI. Los cálculos automáticos están basados en análisis estereológicos y estadísticos clásicos. Estos resultados computacionales se muestran en la pantalla del ordenador y se pueden exportar a entornos de terceros (como Excel o Word) para su visualización y posterior análisis específico para el campo aplicable.
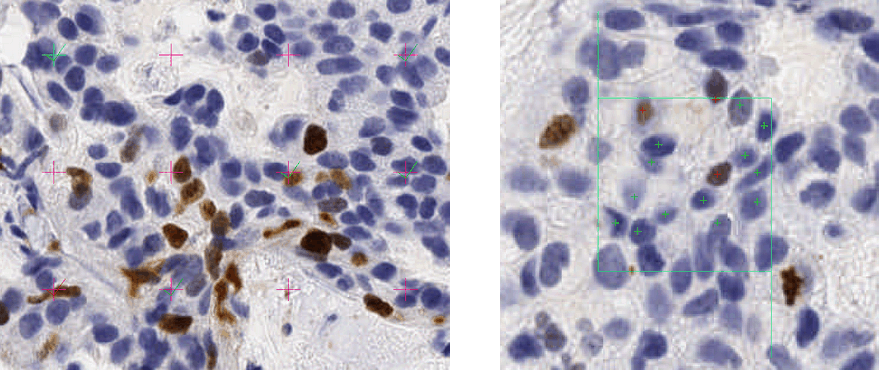
Métodos de cuenta: Puntos vs Cajas
Validación de algoritmos de procesamiento de imágenes
Los expertos en el ámbito pueden utilizar el Stereology Analyzer para poder calcular rápidamente las estimaciones imparciales de parámetros de SOI en diapositivas virtuales. Si se usa correctamente, el Stereology Analyzer es una alternativa eficaz para los programadores/ desarrolladores de procesamiento de imágenes para que confirmen una secuencia de procesamiento de imágenes. Además, aunque los algoritmos complejos requieren una validación precisa de sus resultados, los resultados estereológicos no requieren validación, ya que los resultados se derivan de un análisis estadístico estándar de elementos de cuadrícula y SOIs resaltados por el usuario.
En el ámbito de la medicina, cuando los SOIs no pueden destacarse por una tinción específica (tinciones histoquímicas e inmunohistoquímicas), o cuando la tinción no es óptima o el tejido es heterogéneo, entonces las técnicas de estereología son las mejores alternativas para poder estimar precisamente los valores de parámetros de los SOIs.
Cuando la tinción específica es efectiva, se pueden desarrollar diferentes algoritmos de procesamiento y análisis de imágenes que varían en su complejidad, precisión y eficiencia. Stereology Analyzer es una poderosa herramienta que permite establecer una precisión de cuantificación que una secuencia de algoritmos debe lograr para ser confiable. El proceso de muestreo estadístico utilizado en la ciencia de la estereología disminuye el difícil problema resultante de la heterogeneidad de los tejidos. La fuerza especial de la estereología siempre proporciona estimaciones imparciales de los parámetros de SOI para cualquier complejidad del tejido de la muestra. Al combinar la estereología y el procesamiento de imágenes en campos de patología y microscopia de barrido, el usuario tiene un amplio conjunto de poderosas herramientas para caracterizar las SO en diapositivas virtuales.
Capacidades
Stereology Analyzer tiene las siguientes capacidades:
- Cuadricula: es uniforme y definible por el usuario tanto en densidad como en tipo. Los tipos incluyen puntos, marcos, cuadrados, círculos y líneas
- Región de interés: es definible por el usuario, se permiten múltiples regiones, puede ser de cualquier forma (rectángulo y dibujo a mano libre)
- Tejido no deseado: El usuario puede excluir el tejido no deseado y otras regiones de área no deseadas
- Entrada: Los formatos de imagen de entrada son TIFF, TIFF y JPEG
- Salida: Fracción de volumen, densidad numérica de perfiles de SOI por unidad de área
- Atajos de teclado: Se proporcionan para acelerar el proceso de marcado SOI
Publicaciones relacionadas
[1] G. Matheron, 1975. Random set and integral geometry. J. Wiley and sons, New York, USA.
[2] E.R. Weibel, 1981. Stereological methods in cell biology: where are we–where are we going? J. Histochem. Cytochem., 29, 1043-1052
[3] H. J. G. Gundersen, R. Østerby, 1981. Optimizing sampling efficiency of stereological studies in biology: or “Do more less well!” J. Microsc., 121, 65-73.
[4] V. Howard and M. Reed, 1998. Unbiased Stereology. Three-dimensional measurement in microscopy. Microscopy handbooks 41, Bios Scientific Publishers, UK.
[5] J. Russ, R. Dehoff, 1999. Practical Stereology, 2nd Edition, Plenum Press, New York.
[6] L. Kubınova, X. W. Mao, J. Janacek, J. O. Archambeau, 2003. Stereology Techniques in Radiation Biology, Radiation Research 160, 110-119.
Agradecimientos
El concepto de este módulo se deriva de la experiencia de Estereología de Paulette Herlin y sus trabajos originales de desarrollo en el Centro François Baclesse Cancer Center. La experiencia de Dr Dragos Vasilescu, PhD, en el ámbito de la estereología y el uso de redes combinadas, Universidad de Columbia Británica, Vancouver, V6Z 1Y6, Canadá, ayudó a ADCIS a desarrollar la última versión del producto Stereology Analyzer Software.
Principales beneficios del software Stereology Analyzer
- Realizar mediciones cuando el procesamiento de imágenes no es posible o demasiado complejo
- Un mejor método para validar algoritmos de procesamiento de imágenes en imágenes muy grandes
- Proporcionar mediciones imparciales y una estimación exacta del volumen
- Estimar las características 3D de las estructuras a partir de un corte o proyecciones 2D
- Compatible con la mayoría de los dispositivos de adquisición de diapositivas virtuales